OpenSearch - additional information
This document describes some security aspects of the OpenSearch deployment, that a Software Factory’s administrator should be aware of.
Basic information
The current deployment configures users and tenant into the internal_users file, which is used by the OpenSearch security plugin to populate the “opendistro_security” index. In the future, the configuration would be moved to Keycloack auth system.
Default users and roles:
admin
kibanaserver
logstash
zuul
kibana
The internal_users setups users that are used for internal services. One most important user is kibanaserver user, that should be specified when opensearch-dashboards service is included. The kibanaserver user has specific configuration and the user should not be changed.
The kibana user has very limited permissions, base on official doc.
The readonly user uses kibana_viewer role and the configuration looks like:
kibana_viewer:
  reserved: true
  cluster_permissions:
    - "cluster_composite_ops_ro"
    - "cluster:monitor/main"
  index_permissions:
  - index_patterns:
      - "?kibana*"
      - "?kibana"
      - "logstash-*"
      - "zuul.*"
    allowed_actions:
      - "read"
      - "get"
      - "search"
      - "indices:data/write/update"
      - "indices:data/write/index"
      - "indices:data/write/bulk*"
      - "indices:monitor/stats"
      - "indices:monitor/recovery"
      - "indices:admin/mappings/get"
  tenant_permissions:
    - tenant_patterns:
        - "global_tenant"
      allowed_actions:
        - "kibana_all_read"
In the Software Factory configuration, this user has more permissions comparing to official documentation, because:
- the OpenSearch python client requires additional permissions - cluster:monitor/main, thats needs to be included into the cluster_permissions settings,
- the Grafana service requires additional permissions to get content from the OpenSearch. In that ase, we added indices:admin/mappings/get.
More information about backend roles configuration you can find here and also here.
Additional users and roles
Software Factory’s opensearch role does not support the creation of additional users. However, this can be done manually:
- Generate user bcrypt hash, for example:
python3 -c 'import bcrypt;print(bcrypt.hashpw(b"password", bcrypt.gensalt()).decode())'
- Add user into the internal_users.yml in /etc/opensearch directory like:
<user>:
  hash: <generated hash>
  reserved: false
  backend_roles:
    - <user roles>
  description: Some description
  hidden: true
Warning
This file will be overwritten after re-run sfconfig tool.
- Restart the Opensearch container to apply new changes in OpenSearch container:
sudo podman restart opensearch
- Synchronize settings with OpenSearch by using generated script:
/usr/local/bin/reconfigure-opensearch.sh
The user should be available there.
The same process can be followed after editing roles.yml file that is located in the /etc/opensearch directory. Information about roles you can find in roles doc.
Create user via API
New user can be also created via OpenSearch API. More information how to do it is available in create user doc.
How to get information from OpenSearch
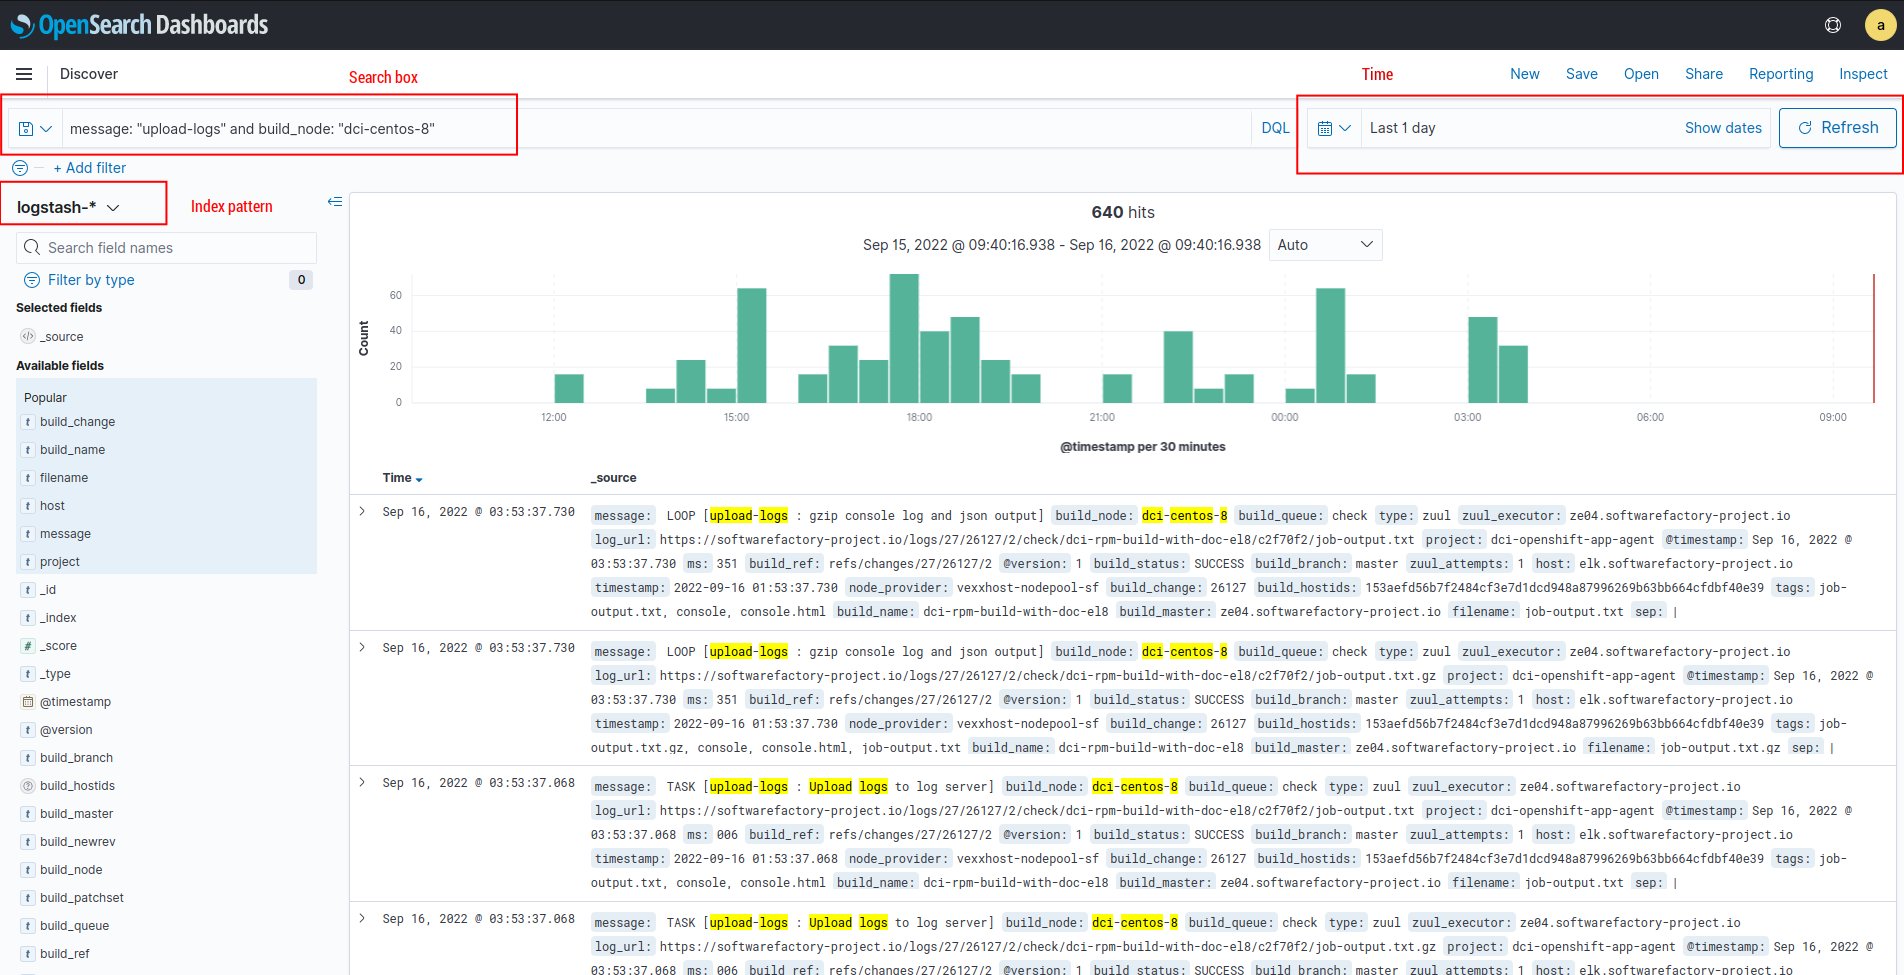
The simpliest way to get the information from the OpenSearch service is to use OpenSearch Dashboards service, that can be also installed in Software Factory Project by adding opensearch-dashboards in arch.yaml file in /etc/software-factory/arch.yaml.
Example screen from OpenSearch Dashboards:

Alternative ways:
- via OpenSearch client. More information in client doc.
- via cURL. Here make sure, that you are doing requests to the index pattern instead of directly to the OpenSearch. For example:
# Basic URL construction

curl -XGET https://<fqdn>/elasticsearch/<index pattern>/_search -H 'Content-Type: application/json' -d'{"query": {"match_all": {}}}'

# Simple query:
curl -XGET "https://kibana_rdoproject_org:rdoproject_org@opensearch.rdoproject.org/elasticsearch/logstash-rdoproject_org-*/_search" -H 'Content-Type: application/json' -d'{"query": {"match_all": {}}}'
# or
curl -XGET --user kibana_rdoproject_org:rdoproject_org "https://opensearch.rdoproject.org/elasticsearch/logstash-rdoproject_org-*/_search" --insecure -H 'Content-Type: application/json' -d'{"query": {"match_all": {}}}'
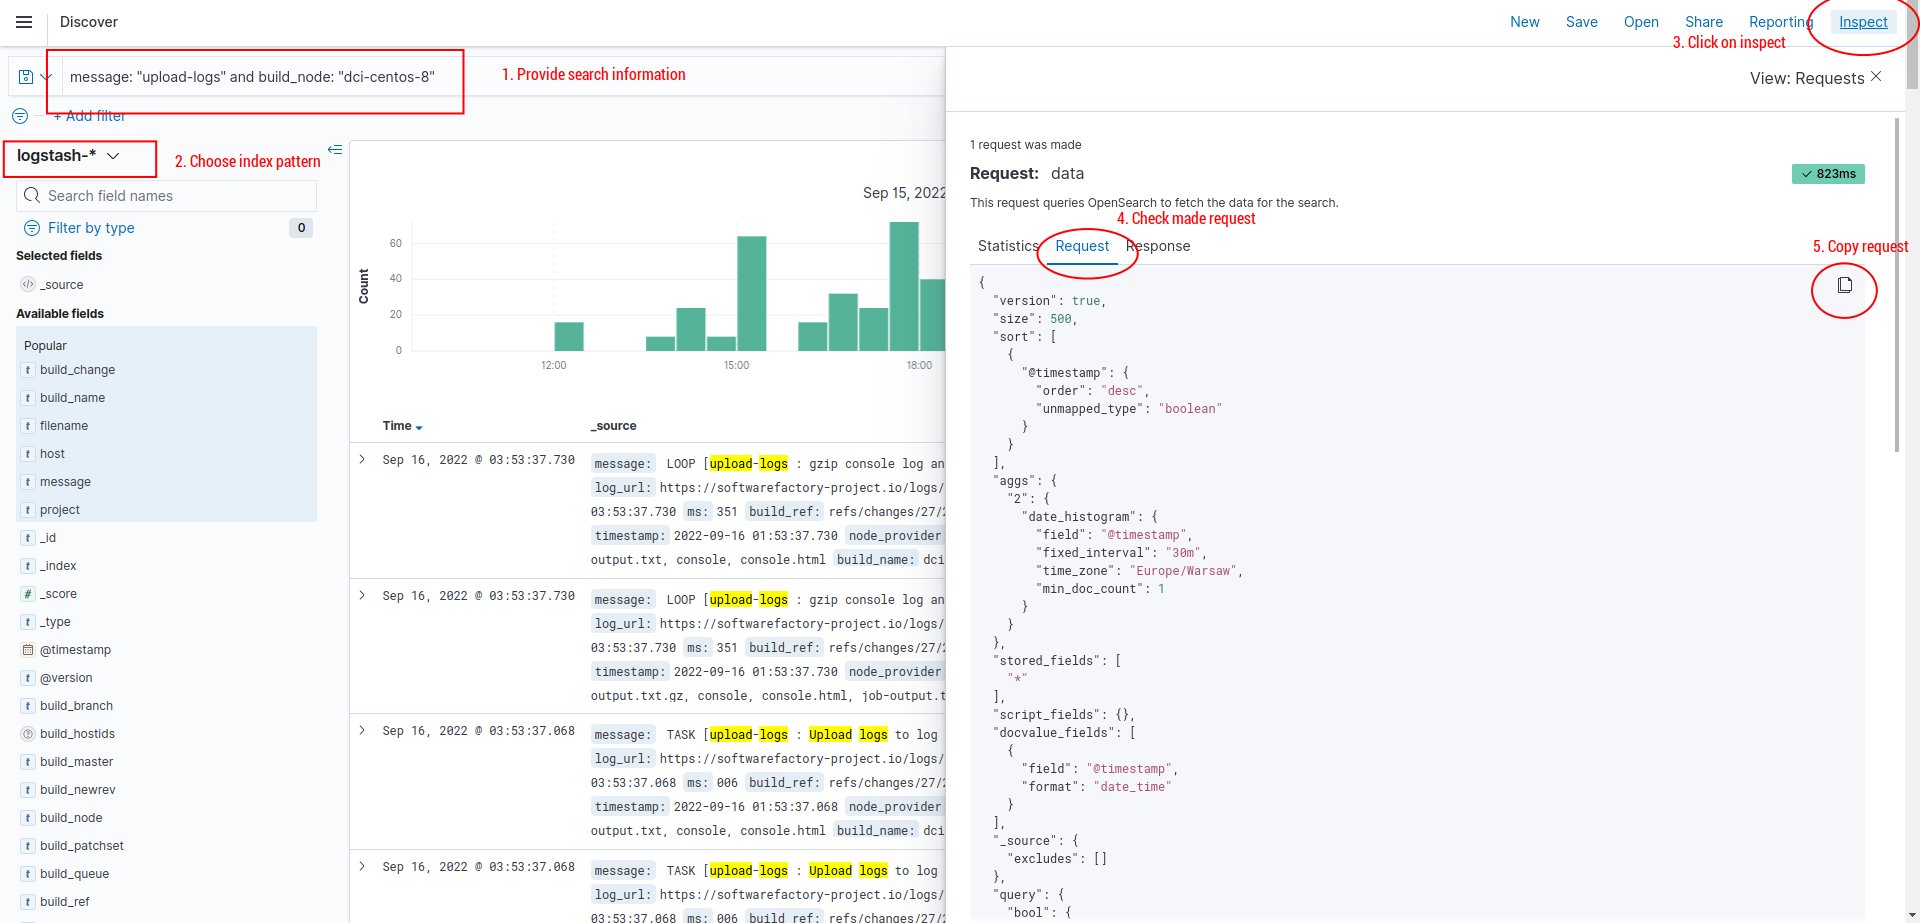
Very helpful for making a query via cURL might be a OpenSearch Dashboards inspect function.

Where generated requests can be moved to the json file and just load the content when making a query. For example:
# Simple query:
curl -XGET "https://kibana_rdoproject_org:rdoproject_org@opensearch.rdoproject.org/elasticsearch/logstash-rdoproject_org-*/_search" -H 'Content-Type: application/json' -d@my.json
where my.json is a request content.
Creating new visualization and dashboards
Currently OpenSearch does not have dedicated user that would be able to create, modify or delete visualizations and dashboards. So far, that content is maintained by an admin user.
If you would like to add a special user for maintaining dashboards and visualization, it requires to add a special role: observability_full_access into the internal_users.yml in /etc/opensearch directory. For example:
<user>:
  hash: <generated hash>
  reserved: false
  backend_roles:
    - <user roles>
    - observability_full_access
  description: Some description
  hidden: true
Warning
The backend role observability_full_access was provided in OpenSearch 1.3, which might not work with current OpenSearch deployment in review.rdoproject.org, softwarefactory-project.io and opensearch.rdoproject.org.
Connect Grafana with OpenSearch
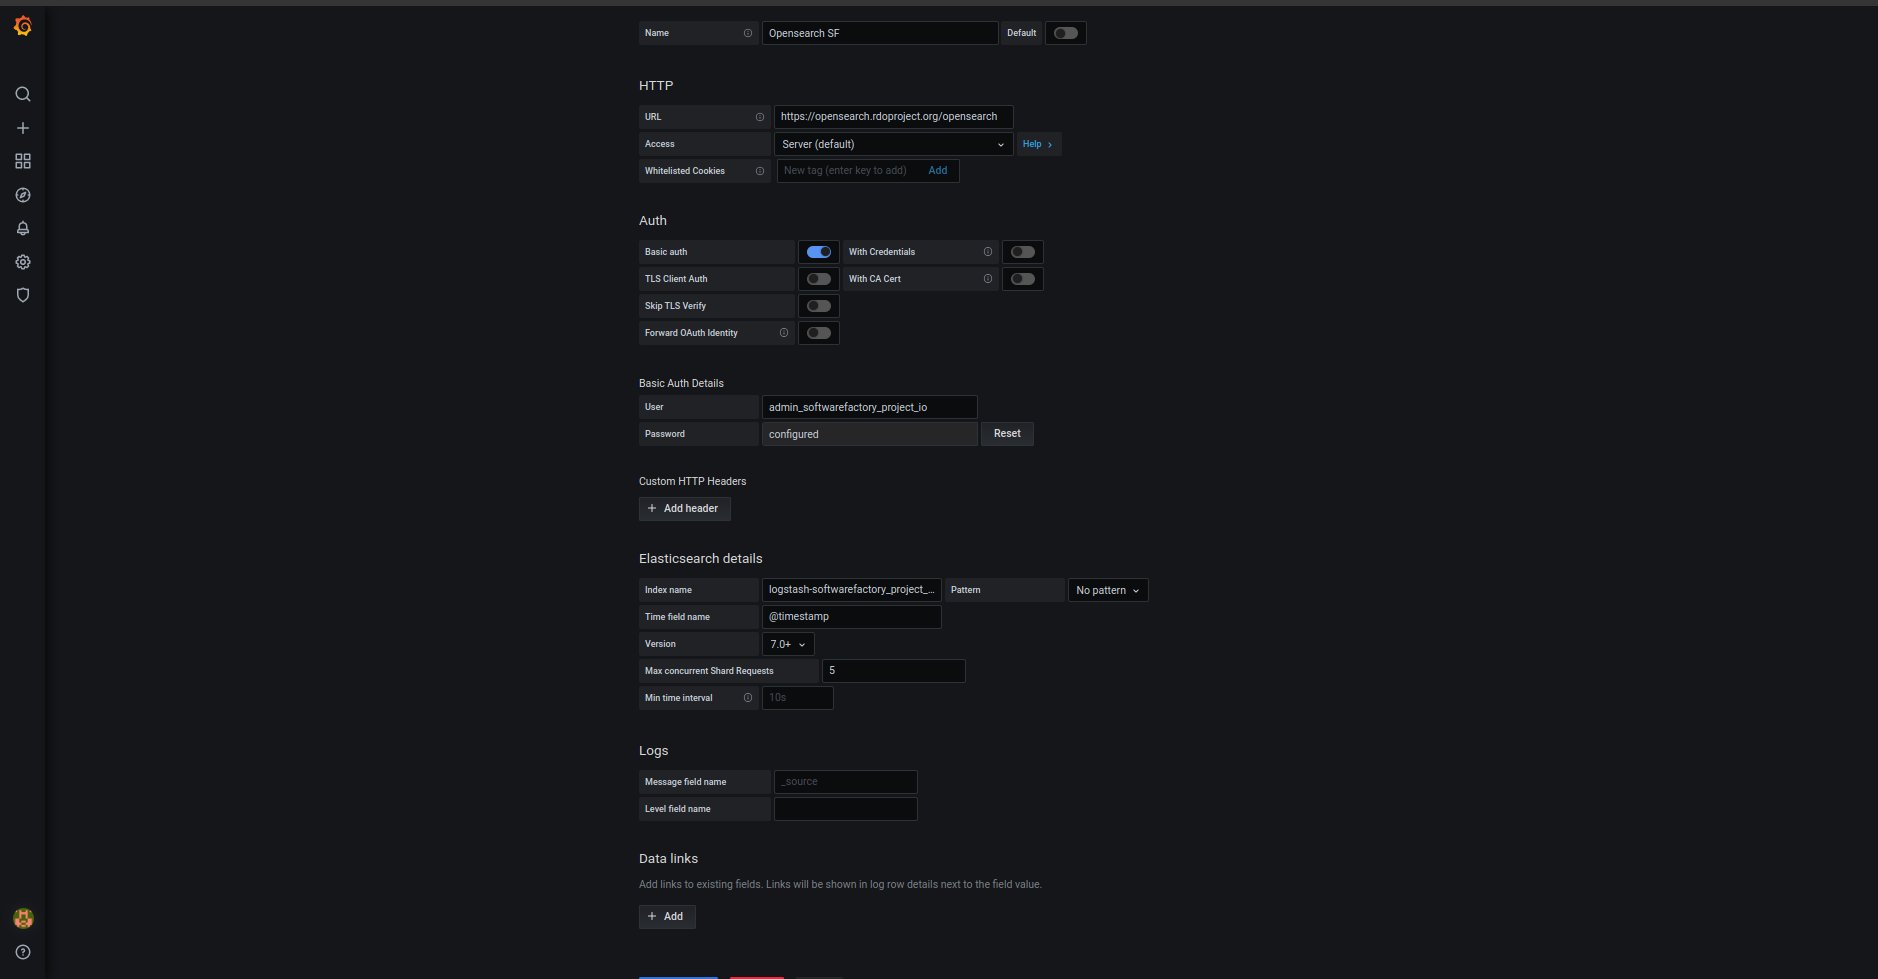
To integrate Grafana with OpenSearch, a new Grafana data source must be defined. The most convenient way to do it is by relying on the OpenSearch basic auth and one of an internal users defined in internal_users.yml. It was mentioned earlier how to create users and roles in section Basic information.
Example configuration for datasource:
apiVersion: 1
datasources:
- name: 'Opensearch RDO'
  orgId: 1
  type: elasticsearch
  typeName: Elasticsearch
  access: proxy
  url: https://opensearch.rdoproject.org/opensearch
  user: '<rdo user>'
  password: '<rdo password>
  database: "[logstash-rdoproject_org-]YYYY.MM.DD"
  basicAuth: true
  isDefault: false
  jsonData:
    esVersion: 70
    interval: Daily
    logLevelField: ''
    logMessageField: ''
    maxConcurrentShardRequests: 5
    timeField: "@timestamp"
It can be also configured via web panel:
